-
Preprocessor Macros for CUDA Errors
TL;DR: Error-Checking Preprocessor Macros for CUDA Fortran and CUDA C/C++. They are also on Github.
When calling functions from the CUDA Runtime API 1, usually an error code is returned. Although this gets ignored by many (most?) of the users, it can give great insight into the wrong-doings of your code.
Error handling is something omitted regularly for smaller code bases. For the CUDA errors, the reason might be in the additional lines of code, cluttering the more directly content-related API calls, or simple laziness.
But fear not! With preprocessor macros, there’s just little overhead to include error handling in your CUDA code.
Here are macros for CUDA C(++) and CUDA Fortran. See also the notes on error checking of kernels at the end.
Macros
C++, C
I do not know who initially came up with the idea. It’s on the NVIDIA devblogs, in a Gist, and also in a lot of the codes of my colleagues. I modified the usual snippet a bit, though, to create what I think is the most informative and concise representation of an error call.
#define CUDA_CALL( call )               \
{                                       \
cudaError_t result = call;              \
if ( cudaSuccess != result )            \
    std::cerr << "CUDA error " << result << " in " << __FILE__ << ":" << __LINE__ << ": " << cudaGetErrorString( result ) << " (" << #call << ")" << std::endl;  \
}
This assumes that
iostreamis loaded. For C, replace thestd::cerr << std::endlstatement withfprintf(stderr, "CUDA error %i in %s …", result, __FILE__, …).Use it by wrapping a plain API call into it:
CUDA_CALL( cudaMalloc( (void**)&ad, csize ); )It will print one line per error, giving the file name and the line number of the error, the raw error code and its explained string; and it will print the actual call (
#call). An erroneous call will then look likeCUDA error 38 in hello-world.cu:50: no CUDA-capable device is detected (cudaMalloc( (void**)&bd, isize );)CUDA Fortran
Since CUDA Fortran is only available through the PGI Fortran compiler, the following is true only for this compiler (especially with regards to the preprocessor and column width). Note: If you find more elegant solutions to the problems discussed in the following, let me know! I still have a lot to learn in the depths that is Fortran.
In general, there is no limitation in using a similar macro in CUDA Fortran code compared to the CUDA C version. But: Column width. Also when using modern Fortran 90 (
.F90)2, PGI’s Fortran compiler only allows for lines with a width of 256 characters. And because the preprocessor is not able to propagate line breaks into the target source, the error-check-augmented resulting line will be quite long. If you run into a line-too-long error, consider using shorter variables, which is ugly and horrible and arrrr, Fortran, but that’s just the way it is.3 Another workaround would be the one explained for kernels later on. The line length is also the reason I opted for removing whitespace and non-descriptive variables. Sorry.Macro:
#define CUDA_SUCCESS 0
#define CUDA_CALL__(e,fmt,c) \
e=c; \
if(e/=CUDA_SUCCESS) \
write(*,fmt) "CUDA Error ",e," in ",__FILE__,":",__LINE__,": ",trim(cudaGetErrorString(e))," (",#c,")"
#define CUDA_CALL(c) CUDA_CALL__(gpuStatus,fmt,c)
The macro lives best closely together with a module which provides
gpuStatusand the format stringfmt. It can then be used in any instrumented routine/program with ause debug:module debug character(len=27) :: fmt = "(A,I0,A,A,A,I0,A,A,A,A,A,A)" integer :: gpuStatus end module debugCUDA_CALLis a shortcut toCUDA_CALL__. The latter is in case one wants to use a different status variable (for reuse or explicit checking) or a different format string.Error Checking on Kernels
Kernels do not have a return value so the usual means of error checking will not work on them. Instead, use a macro-wrapped
cudaGetLastError()4 directly after the kernel launch, plus a wrappedcudaDeviceSynchronize()if there aren’t any other subsequent API calls or to help structure error messages.CUDA_CALL( cudaGetLastError(); ) CUDA_CALL( cudaDeviceSynchronize(); )This method works in all cases where the error code can not be handled directly, e.g. if the Fortran line is too long.
-
Although all of the written is true for the CUDA Driver API, I will refer to the Runtime API, since this is the more commonly used method of access to the GPU. ↩
-
Make sure to give your filenames a capital
FinF90to include preprocessing on the file. ↩ -
On StackOverflow, user talonmies adds an additional routine to reduce the length of the preprocessor macro. This should affect line-too-longs in Fortran beneficially, but comes with other caveats. It could be worth to do, though, if line-too-longs are a regular problem. ↩
-
This StackOverflow answers uses
cudaPeekAtLastError(). But as far as I see it the result should be equal. ↩
-
-
SC16 tutorial on OpenPOWER and GPUs (including a TALK)
On 14 November we held a tutorial on »Application Porting and Optimization on GPU-Accelerated POWER Architectures« during the Supercomputing Conference in Salt Lake City. The tutorial allowed me to travel to this largest conference on supercomputing-related topics for a first time. It was a busy, but great experience! I actually wrote a bit about it for the Jülich blog portal.
In the tutorial we spoke about
- the new POWER8NVL architecture, including its large bus to NVLink-equipped Tesla P100 GPUs,
- how to measure an application’s performance by means of hardware performance counters,
- how to use compiler flags to speed-up an application’s runtime - and what’s behind the flags,
- what’s new in the Tesla P100 GPUs,
- how to use OpenACC to run a program across a few of the GPU devices at once, and
- how an actual application can make use of the new features (especially the larger bus).
For three of the six parts we also had hand-ons where attendees of the tutorial could try out the various things taught. Since the POWER8NVL+P100 setup is so new, we actually had to use a machine in Jülich. Despite some general lag and initial WiFi problems in the room, this worked out surprisingly well. Every attendee downloaded an SSH key, signed a Usage Agreement, and exchanged it for the password to the key. Then they were good to go.
The organization of the tutorial was also an interesting study in international collaboration. We worked together with colleagues from Switzerland, the States, and India. Timezones nicely tripartite1, nearly at least. Also a peculiarity: We had to hand in all slides and material 2.5 months before the actual conference. Quite challenging when you speak about unreleased hardware…
In the end, the tutorial turned out quite well. In the evaluation, attendees gave us above average and close to best marks in all categories. Yay!
The slides and sets of source code are not available publicly, unfortunately. But here are mine! Slides, anyway.
I had the second talk (and subsequent first hands-on): »Performance Counters and Tools«. After the first talk, which introduced the POWER8 chip and related software infrastructure, I zoomed in on performance analysis with performance counters. This was a new topic for me as well it was assigned to me after a colleague left the institute. Although I worked with some performance counters before, my knowledge was not anywhere near the level of being able to knowledgeable teach others. So: Reading, testing, digging through documentation, finding use-cases. Detailed work, but as researchers this is in our job description after all.
In the end I had enough content to hold a 50 minute talk (easily). So much interesting stuff is to be told about performance counters! To cut it down to 30 minutes I moved a lot of the material into the appendix. Not ideal, but since the attendees receive the slides anyway, at least the work was not in vain this way.
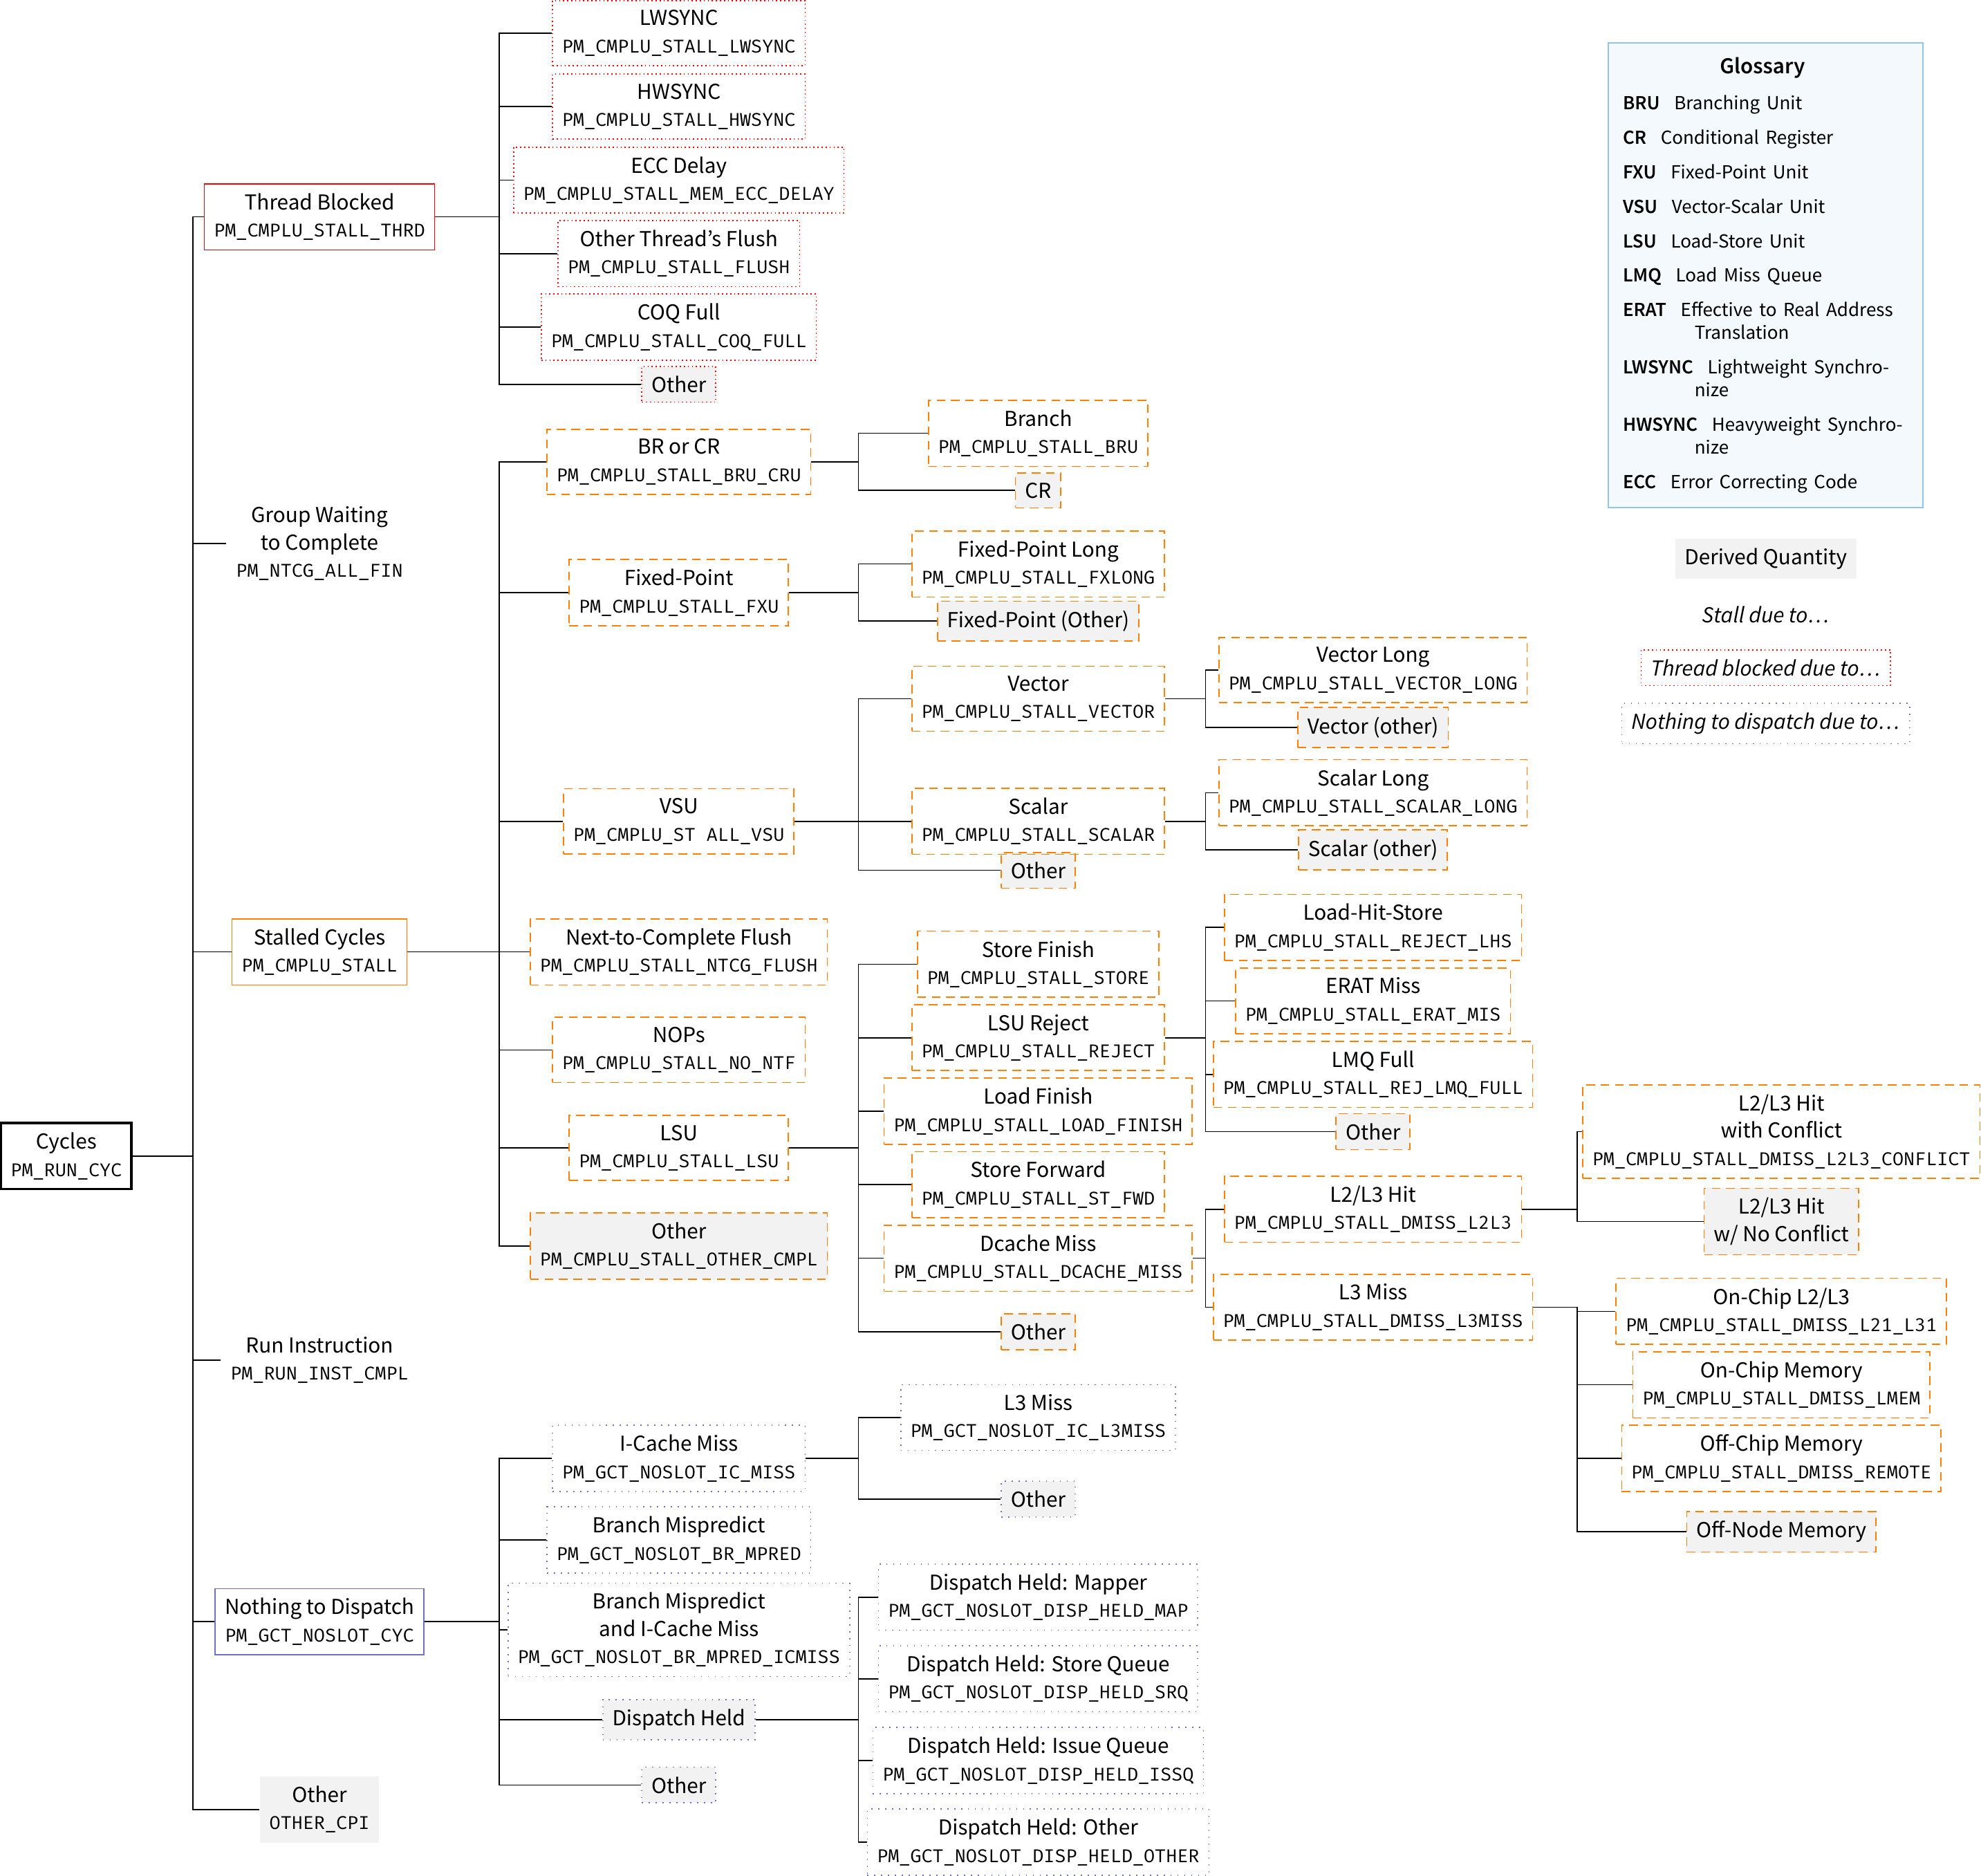
My hands-on afterwards focused on measuring stalls of a matrix multiplication. I use the number of stalls due to data cache misses (PMU code
PM_CMPLU_STALL_DCACHE_MISS) once with a simple, un-optimized matrix-matrix multiplication and once with a matrix multiplication in which the inner two loops are interchanged. This reduces the amount of misses by two orders of magnitude and leads to a speed-up of about 20 %. The message was along the lines of: Stalls are bad, they can be reduced by clever code tuning; but their impact is also hidden by modern processor features.
If you’re interested, you can find the slides of the talk after the click. The slides I actually presented (with all the overlays) are here. For the time being, the source code for my hands-on is not available publicly. If you want them, give me a note.
I also remade IBM’s POWER8 CPI stack diagram into tree form. I like it better this way, although one could argue that the original table version also has its use. Here’s the PDF, a PNG, and also the TeX file.
→ continue reading!-
I looked this up. It is supposed to mean divided by three, since India, Germany, and USA are roughly arranged in three equivalently distant time zones. ↩
-
TALK: Accelerating Plasma Physics with GPUs
A few weeks ago we had the annual workshop of one of the groups I’m involved in, the POWER Acceleration and Design Centre (PADC).
In the scope of the PADC we investigate new processors offered by IBM and the OpenPOWER consortium and how well the architectural choices map to applications. One of the features of the latest incarnation of the POWER processor chip is its connection to NVIDIA’s GPUs: The POWER8NVL employs a new, larger bus to connect to the GPU device – NVLink. The processor can make use of NVLink to exchange data with the GPU more than four times as fast compared to usual PCI-Express interfaces.1 Neat!
I’m yet to dive fully into the new world of POWER8NVL, NVLink, and NVIDIA’s Pascal GPU on the other side, since there are only few systems available right now. It’s brand new. But for evaluating the combination of the integrated design of POWER8 CPU and Pascal GPU for a specific project (the Human Brain Project, read more about the precommerical precurement here) we actually received a small test system with this brand new architecture. 2 Unfortunately, the machine only arrived shortly before the PADC workshop. There was no time for extended tests. But on Sunday afternoon before Monday’s workshop I managed to measure at least one aspect of one of my app’s behaviors. Yay!
You can see the performance of JuSPIC, a plasma physics application I’m researching, under the assumption of a simple information exchange model on the Pascal P100 GPU in a POWER8 system in the second part of the presentation. In the somewhat larger first part of the talk, I show what techniques I used to begin accelerating the application on the GPU. I started out with OpenACC, a
pragma-based acceleration programming model, but soon found out that the code is a bit too complex for the compiler I use. See the slides for how it turned out.I hope to continue the acceleration as well as the performance analysis (with a more refined model) soon. But I’m busy with other cool stuff right now.
You can find a handout version of the slides on the webpage of the workshop – or after the click; the version with all the overlays is also available, though.
Let me know what you think!3
→ continue reading! -
Collected: LaTeX Beamer Tips, Tricks, Workarounds
I recently compiled two 30+ minute talks in LaTeX Beamer. While the output of LaTeX usually is great, getting there is not. There are many things which can (and will) go wrong; many commands and techniques you only discover after a lengthy workaround; and, anyway, sigh, workarounds…!
The usual way to deal with any LaTeX insufficiency is to discover the solution in a post on StackExchange, you already read last week a couple of times. Or you read through some of the documentation and hope to find the solution in there.
Well, here follows a list of all the neat tricks I searched for, stumbled upon, or discovered myself. All somehow related to creating presentations in LaTeX: LaTeX Beamer, TikZ, and more.
Beamer
Handout from Same File
Apart from producing slides for presentations, Beamer has support for handouts built in. Adding
[handout]as a option to thebeamerdocument class will initialize the mode.In handout mode, all overlay specifications are reduced to one same value: 1. If overlays in handout mode are still needed, those can explicitly given by adding
| handout: 1to the overlay specification, i.e.\only<2- | handout: 3>{}(this will print its argument usually from overlay two on, but in handout mode only on slide three).To typeset a handout version from the same file as the presentation slides, without adding and removing
[handout]all the time, I created a second file (ah-conference--handout.tex) and added the following line:\PassOptionsToClass{handout}{beamer}\input{ah-conference}This will insert the whole content of
ah-conference.texinto the file and pass thehandoutoption tobeamer. Typeset as usual 1, done ✓.→ continue reading!-
You should use
latexmkfor typesetting, by the way. It’s great. Also, it can be steered by a.latexmkrcfile on a per-folder basis. ↩
-
-
TALK: GPUs: Platform, Programming, Pitfalls
Last Thursday, on 1 September, I held a talk at the GridKa Summer School 2016. Under the general topic of Data Science on Modern Architectures I introduced 30 Minutes programming on GPUs.
This was my first general introduction talk on the GPU platform, so I started from scratch (and tried only to be influenced as little as possible). Additionally, I made the slides completely in LaTeX Beamer. Using a lot of TikZ adds an additional layer of cumbersomeness on-top of the usual LaTeX cumbersome experience. 1
Anyway: I think the talk turned out quite well. I got some interested follow-up questions afterwards, especially in the coffee break. 2 The work was well worth it!
An embed of the slides follows. This is the handout version. You can also download the actual set I presented, which has more overlays to guide my story.
→ continue reading! -
Clang's Optimization Levels
Clang is a neat compiler. I like using it.
For some manual optimization of a source code I was interested in the exact difference between the automatic optimization levels
-O1to-O3. What are they doing anyway?It turns out, this info is not so easy to come by.
The official documentation of Clang specifies quite coarsely the different levels:
-O2: Moderate level of optimization;
-O1: Somewhere between -O0 and -O2Yay.
Luckily there’s StackOverflow.
In this answer by Antoine, the two lines needed to get the optimization passes are printed:
llvm-as < /dev/null | opt -O1 -disable-output -debug-pass=Arguments
echo 'int;' | clang -xc -O1 - -o /dev/null -\#\#\#
The first line uses
opt, which is the modular LLVM optimizer and analyzer, running on LLVM source files and, I reckon, being independent of the actual programming language. 1The second command prints the optimization passes which
clang, the C/C++ driver of LLVM, puts on top ofopt.This will not explain anything, but solely print the switches used. To understand what lies beneath each switch, LLVM has an explanatory website about the passes (
opt --helpwill also print them, apparently). 2Luckily, Antoine has compiled the passes Clang uses in the above posting. (At least until Clang 3.8.)
-
CUDA Course 2016: CUDA Tools
Last week we had a CUDA course for the students of our guest student program. I held the session on CUDA Tools; that is, NVIDIA tools for programming, debugging, and profiling of GPU applications.
Here are the slides, which are closely based on my colleague Jiri Kraus’ slides of the open-to-public CUDA course earlier this year.
Download the slides here, or see them embedded below.
→ continue reading! -
Reduce Filesize of PDF-embedded Bitmap Images with Ghostscript
Ghostscript is a powerful tool for manipulating PDF and PS files. But with great power comes great complexity. Here are examples on embedding fonts and reducing image size with it!
Embedding Fonts
Usually, your PDF typesetting program takes care of embedding fonts into a PDF document (PDFLaTeX does); but sometimes you have strange sources of PDFs: My ROOT-generated plots for example do not embed their fonts1.
In a blog post, Karl Rupp summarizes how to embed fonts into PDFs from different sources. To really embed ALL the fonts, also those usually ignored by Ghostscript, you have to dive in even deeper. Here is the command, which I found in a Stackoverflow reply:
gs -dCompatibilityLevel=1.4 -dPDFSETTINGS=/screen -dCompressFonts=true -dSubsetFonts=true -dNOPAUSE -dBATCH -sDEVICE=pdfwrite -sOutputFile=output.pdf -c ".setpdfwrite <</NeverEmbed [ ]>> setdistillerparams" -f input.pdfA quicker alternative to Ghostscript is the
pdftocairocommand of the poppler PDF library. The command enables conversion to different vector graphics formats2. But it can also convert from PDF to PDF, embedding the fonts in the process.pdftocairo input.pdf -pdf output.pdfChanging Image Quality
For printing a document, you probably want to have it available in the best quality possible. For uploading it somewhere for sharing with your friends, file size might be more important than quality. Usually, in best vector fashion, the bulk of bits of a LaTeX-set document are taken by bitmap images (or bitmap-like raster images like JPG, PNG, …). Ghostscript offers a batch way to reduce the size of all embedded bitmap-like images.
Everything revolves around the
-dPDFSETTINGS=/setting. It can take different values, e.g.screenfrom the command above (equivalent to 72 dpi images) toprepress(300 dpi). A one-liner to get all images of a document down to 150 dpi would begs -sDEVICE=pdfwrite -dCompabilityLevel=1.4 -dPDFSETTINGS=/ebook -dNOPAUSE -dQUIET -dBATCH -sOutputFile=output.pdf input.pdfSince I’m lazy and don’t want to memorize this, I made a small, encapsulating shell script a while ago to reduce the PDF’s size by means of image compression:
reducePdfSize.sh.Using
pdfimages -allon my thesis, which is in total 41 MB of size, results in extraction of about 21 MB images – half of the data in the PDF of my thesis is for bitmap images. Using the above Ghostscript command onthesis.pdfreduces the 41 MB to 15 MB, using the printer option3.
Not bad, right?